
Authors
Published January 2026.
Translation note: The official version of this thesis was written in Brazilian Portuguese (pt-BR). This post is an English translation of that original version.
Abstract
This study examined the influence of Design Systems on the development of digital public service interfaces in the state of Piauí, focusing on the perceptions of front-end developers and UI/UX designers. A structured questionnaire was administered to public-sector professionals to assess how the adoption of Design Systems affects interface standardization, delivery speed, rework reduction, and maintenance efficiency. The findings indicate a predominantly positive perception, highlighting improvements in visual consistency, agility, and workflow predictability. Challenges were also reported, particularly regarding continuous team training and maintenance processes in small development teams. Although the sample was limited to two public institutions, the results provide an initial overview of Design System adoption in Piauí and offer insights to support improvements in digital design practices within the public sector.
Keywords: Design Systems; Front-End Development; UX/UI in digital public services.
1. Introduction
Digital transformation has profoundly redefined the relationship between the state and citizens in Brazil. According to the World Bank (Brasil, 2022), the country ranks second globally in digital government maturity, driven by the widespread adoption of the gov.br platform, used by approximately 80% of the adult population. Despite these advances, challenges persist in creating digital public services that are intuitive, accessible, and consistent, capable of meeting society’s needs inclusively and efficiently.
In this context, Design Systems have become established as a central strategy for improving the development of digital products and services. They constitute a structured collection of reusable components, visual patterns, and interface guidelines that promote standardization, scalability, and coherence throughout the design and development cycle (Figma, 2024).
Their adoption encourages collaboration among User Interface (UI) designers, responsible for defining the visual and interactive elements of screens; User Experience (UX) designers, who focus on usability, accessibility, and interaction quality; and front-end developers, responsible for technically implementing these interfaces in a computing environment. This integration narrows the gap between visual conception and technical implementation, while also contributing to the accessibility and responsiveness of digital solutions (Wowmakers, 2023).
In Piauí, the topic takes on additional relevance. The state was recently recognized as Brazil’s most digital state, as reported by Folha do Piauí (2025), following innovation policies and continuous investment in government modernization. Investigating how Design Systems are used in this environment therefore makes it possible to understand their role in team efficiency and the quality of digital interfaces offered to the population.
Accordingly, this study aims to analyze the influence of Design Systems on the development of digital public service interfaces in Piauí, focusing particularly on interactions between designers and developers. It seeks to identify how these systems can mitigate recurring problems such as visual inconsistency, rework, limited scalability, and maintenance difficulties, factors that undermine the usability and efficiency of digital services.
The general objective of the research is to investigate the impacts of adopting Design Systems on the digital interface development process in Piauí. To this end, the following specific objectives were defined:
- Analyze the extent to which teams adopt Design Systems;
- Evaluate their contribution to reducing rework;
- Assess their influence on delivery speed;
- Examine how they support the maintenance and continuous evolution of digital interfaces.
The relevance of this study manifests itself in two dimensions. Socially, it reinforces the importance of consistent and accessible interfaces in promoting satisfactory experiences for citizens. Technically, it contributes to understanding how practices based on Design Systems can improve collaborative processes and raise the quality of solutions produced by multidisciplinary teams.
Academically, the study seeks to fill a gap concerning the application of Design Systems in specific state contexts, which remain underexplored in Brazilian literature. Although research addresses their benefits in corporate and federal environments, analyses focused on local realities, such as Piauí, remain scarce. Based on the assumption that adopting Design Systems has positive effects on development practices, the following hypotheses were formulated:
- Hypothesis 1: Using Design Systems positively influences the efficiency of the development process, increasing delivery speed and reducing rework.
- Hypothesis 2: Using Design Systems contributes to the quality and sustainability of digital solutions, promoting standardization, consistency, and ease of maintenance.
Validating these hypotheses makes it possible to understand more broadly the role of Design Systems in consolidating user-centered development practices aligned with the demands of the digital public sector in Piauí.
2. Theoretical Background
The theoretical background of this study was developed through a bibliographic survey organized into thematic areas, with the aim of structuring the literature review. This approach enabled the collection and analysis of relevant theoretical contributions, providing a solid conceptual foundation for understanding the topic investigated. Furthermore, organizing the review by thematic areas helps connect the concepts discussed with the methodological procedures adopted, contributing to the coherence and scientific rigor of the work.
2.1 Area 1 - Design Systems and Visual Standardization
Design Systems are structured collections of reusable components, visual guidelines, and design principles that ensure consistency, coherence, and efficiency in digital interface development. Konaté (2018) argues that adopting Design Systems helps align design practices with organizational identity, strengthening visual communication across products and teams.
Linder and Nilsson (2022) state that the standardization provided by these systems is essential in complex environments where multiple teams work simultaneously. Component reuse reduces fragmentation and ensures visual cohesion. Complementing this view, Gubau Amores, Voces Merayo, and Monclús Blanco (2024) demonstrate that customized component libraries promote efficiency in front-end development and minimize inconsistencies between prototypes and code. Design Systems thus play a strategic role, influencing not only aesthetics but also scalability, visual governance, and the operational efficiency of digital solutions.
2.2 Area 2 - Front-End Development and Collaboration with UX/UI Designers
A Design System acts as a link between designers and developers by establishing a common visual vocabulary and reusable components. Frick (2022) shows that integrating design tools, such as Figma, with development tools facilitates the transition from concept to code.
Abdulhakeem et al. (2024) reinforce this perspective by demonstrating that Component-Driven Development improves testability, reuse, and code quality, helping reduce rework. Izotov (2020) emphasizes that maintaining centralized libraries requires governance, adequate documentation, and test automation, elements that sustain the continuous evolution of a Design System. These studies converge in indicating that Design Systems strengthen multidisciplinary collaboration and provide more efficient and predictable processes.
2.3 Area 3 - Digital Public Services (GovTech)
The modernization of digital public services forms part of a broader movement of institutional transformation. Lindgren and Van Veenstra (2018) emphasize that digital government initiatives involve simultaneous adjustments to technical, organizational, and regulatory aspects.
Malodia et al. (2021) propose an integrated digital government model and state that citizen-centeredness is decisive for the success of these initiatives. Nielsen and Barbosa (2022) identify consistent design standards, governance, and clear guidelines as essential elements for ensuring usability and quality in digital services. This evidence reinforces the relevance of Design Systems to the continuous improvement of public services, since they enable visual standardization and improvements to the citizen experience.
2.4 Area 4 - User Experience and Accessibility
Contemporary usability practices encompass cognitive, emotional, and inclusive dimensions of interaction with digital systems, as discussed by Gujar (2025). In the context of Design Systems, these aspects are essential to ensuring that components and guidelines accommodate diverse users and devices.
Khalilova (2025) demonstrates that the organization of information architecture and the clarity of component libraries directly affect navigation efficiency and user satisfaction. Accessibility, consistency, and clarity are therefore central pillars in creating and maintaining an effective Design System, especially in public-sector environments.
2.5 Area 5 - The Brazilian and Piauí Context
In Brazil, standardization and interoperability are fundamental to strengthening the digital government ecosystem. The Federal Government also maintains the Brazilian Government Design System (GOVBR-DS), which brings together guidelines, components, and guidance for creating accessible, consistent, and standardized interfaces for products and services (Brasil, 2024). Xisto et al. (2022) present a reference architecture aimed at integrating and reusing solutions across different administrative levels.
In Piauí, institutions such as ETIPI, SEAD, and PRODATER play leading roles in the state’s digital transformation. Their modernization and technological standardization initiatives demonstrate the growing importance of strategies such as Design Systems in developing digital public services.
3. Methodology
The study adopted an exploratory and descriptive approach to understand practices, benefits, and challenges related to the use of Design Systems in digital interface development in Piauí’s public sector. The methodology was organized into two main stages: a systematized bibliographic survey and a descriptive survey conducted through a questionnaire. This structure made it possible to align the hypotheses, study objectives, and data collection and analysis procedures.
3.1 Bibliographic Survey
The first stage consisted of a systematized bibliographic survey intended to identify, organize, and analyze the main theoretical references related to the phenomenon under study. The search was structured around five thematic areas defined in the theoretical background, covering Design Systems, collaboration between front-end and UX/UI professionals, digital public services, accessibility, and the Brazilian/Piauí context.
The search strings used at this stage were developed based on the principles presented by Napoleão (2019), who emphasizes the importance of formulating structured Boolean expressions to ensure breadth, precision, and reproducibility in systematized reviews. According to the author, combining keywords, synonyms, and logical operators increases search recall and ensures that relevant studies are not omitted during source identification.
Following these guidelines, specific strings were constructed for each thematic area of the research to encompass different conceptual approaches related to the topic and ensure methodological rigor in retrieving the literature used as the basis for the theoretical background. Applying these search strategies yielded a final set of studies selected to form the work’s theoretical foundation.
Considering the studies actually used, the recall achieved can be characterized as operationally satisfactory, since the strings developed allowed the retrieval of a broad volume of relevant publications, which were subsequently filtered according to thematic alignment and the research objectives.
Searches were conducted in SpringerLink, IEEE Xplore, ScienceDirect, ACM Digital Library, MDPI, and Google Scholar, covering publications from 2018 to 2025. The starting year of 2018 is justified by the publication of foundational studies on the strategic effectiveness of Design Systems. Ending in 2025 captures the state of the art and coincides with the milestone in Piauí’s digitalization, as well as the period in which the study’s primary data were collected. Results were analyzed for thematic relevance, recency, and alignment with the study’s specific objectives.
The first area, Design Systems and visual standardization, aimed to investigate how Design Systems contribute to standardization, consistency, and efficiency in digital interface design. The following search string was used:
("design systems" OR "component libraries" OR "design tokens") AND ("interface design" OR "UI consistency" OR "visual guidelines")The second area, Front-end development and collaboration with UI/UX designers, focused on analyzing the role of Design Systems in integrating developers and designers in multidisciplinary workflows, emphasizing communication and productivity. The string applied was:
("design systems" OR "UI frameworks") AND ("developer collaboration" OR "frontend development" OR "design handoff")The third area, Digital public services (GovTech), addressed the application of Design Systems in portals, platforms, and digital public service interfaces, considering usability guidelines, governance, and the citizen experience. The string used was:
("design systems" OR "component libraries" OR "UI frameworks") AND ("digital government" OR "e-government" OR "public digital services" OR "citizen experience" OR "government digital services" OR "digital transformation in public sector")The fourth area, User experience and accessibility, focused on evaluating the impact of Design Systems on usability, accessibility, and the quality of the user experience. The corresponding string was:
("design systems" OR "UI design systems") AND ("user experience" OR "accessibility" OR "usability evaluation")The fifth area, The Brazilian and Piauí context, sought to identify studies and use cases of Design Systems applied to digital government in Brazil, emphasizing the state of Piauí and digital transformation policies. The string adopted was:
("design systems" AND "digital government") AND ("Brazil" OR "Latin America" OR "public sector")The results obtained were organized and analyzed for thematic relevance, methodological quality, and alignment with the research objectives.
3.2 Results of the Bibliographic Survey in Research Databases
Table 1 - Design Systems and visual standardization
| Research database | Number of results |
|---|---|
| SpringerLink | 6 |
| IEEE Xplore | 0 |
| ScienceDirect | 5 |
| ACM Digital Library | 16 |
| MDPI | 0 |
| Google Scholar | 121 |
Source: Prepared by the author (2025).
Table 2 - Front-end development and collaboration with UI/UX designers
| Research database | Number of results |
|---|---|
| SpringerLink | 16 |
| IEEE Xplore | 0 |
| ScienceDirect | 21 |
| ACM Digital Library | 39 |
| MDPI | 0 |
| Google Scholar | 225 |
Source: Prepared by the author (2025).
Table 3 - Digital public services (GovTech)
| Research database | Number of results |
|---|---|
| SpringerLink | 28 |
| IEEE Xplore | 1 |
| ScienceDirect | 69 |
| ACM Digital Library | 60 |
| MDPI | 13 |
| Google Scholar | 749 |
Source: Prepared by the author (2025).
Table 4 - User experience and accessibility
| Research database | Number of results |
|---|---|
| SpringerLink | 170 |
| IEEE Xplore | 1 |
| ScienceDirect | Search error |
| ACM Digital Library | 379 |
| MDPI | 14 |
| Google Scholar | 2910 |
Source: Prepared by the author (2025).
Table 5 - The Brazilian / Piauí context
| Research database | Number of results |
|---|---|
| SpringerLink | 6 |
| IEEE Xplore | 0 |
| ScienceDirect | Search error |
| ACM Digital Library | 37 |
| MDPI | 1 |
| Google Scholar | 246 |
Source: Prepared by the author (2025).
3.3 Descriptive Survey
The second stage of this study consisted of a descriptive survey conducted through a structured form. The instrument targeted front-end developers and user experience and interface (UX/UI) designers working in companies and public agencies responsible for creating digital solutions for Piauí’s public sector.
The participating institutions were selected based on their strategic relevance in the State of Piauí’s technology, innovation, and digital services ecosystem, encompassing different levels of public administration. This enables a broad analysis of Design System adoption and impacts in distinct institutional contexts.
3.4 Selected Institutions
The institutions originally expected to participate in the research are presented below. Identifying these institutions contextualizes the scope of the study and helps explain the different organizational settings considered in the investigation. Describing each agency’s actual participation also contributes to methodological transparency, enabling an appropriate interpretation of the results.
3.4.1 PRODATER (Teresina Data Processing Company)
PRODATER is the municipal public institution responsible for providing information and communication technology (ICT) services to Teresina’s municipal administration and third parties. Its work includes operational and strategic support for the digital modernization of local public services (PRODATER, 2025). PRODATER’s inclusion is justified by its central role in developing and maintaining municipal digital solutions, allowing an analysis of how Design Systems contribute to standardization and efficiency at this level of government.
3.4.2 ETIPI (State of Piauí Information Technology Company)
ETIPI is a mixed-capital company linked to the Government of the State of Piauí, working on the development of strategic and foundational technological solutions. Its projects include essential systems for state public administration (ETIPI, 2025). Given its strategic position and the scope of its deliverables, ETIPI was included in the study to enable an analysis of Design System adoption in large-scale, highly complex initiatives. Although its participation was anticipated in the initial plan, ETIPI was unable to submit responses within the established data collection period, preventing its inclusion in the results presented in this research.
3.4.3 SEAD (State of Piauí Department of Administration)
SEAD is responsible for coordinating administrative management, innovation, and digital transformation policies at the state level. Its responsibilities include promoting technological integration among public agencies, contributing to the standardization and governance of digital initiatives (SEAD, 2025).
Its participation in this study is justified by its strategic role in formulating and guiding technology policies, offering an essential perspective on the use of Design Systems in the state’s public sector. Although it submitted responses during the collection period, the number obtained was smaller than anticipated in the initial plan because of the time available for participation, resulting in more limited institutional representation in the research data.
3.4.4 Opala Lab (Court of Justice of the State of Piauí)
Opala Lab is the Innovation Laboratory of the Court of Justice of the State of Piauí (TJPI), working on digital solution development and promoting innovative practices aimed at modernizing state judicial services. Its work involves creating, experimenting with, and validating products and interfaces that support the court’s digital transformation, focusing on usability, efficiency, and improving the citizen experience (Opala Lab, 2025). As with ETIPI, Opala Lab was also unable to submit responses within the data collection period, preventing its participation in the results of this research.
3.5 Data Collection
During data collection, Google Forms was used as the research instrument. This platform, part of the Google Workspace suite, enables the creation of structured, customizable questionnaires, allowing questions to be aligned with the study objectives. The tool provided automated, secure collection of responses, with real-time viewing and data export to Google Sheets, facilitating the organization and quantitative analysis of the information obtained.
Using Google Forms contributed to response standardization, faster collection, and practical data processing, essential characteristics for conducting a descriptive survey with multiple respondents. Forms were distributed through direct links and institutional communications, ensuring that only professionals affiliated with the participating agencies had access. Data collection took place from November 13, 2025, to November 24, 2025.
3.6 Likert Scale
A Likert scale was used for data collection. Widely used in opinion and satisfaction surveys, it measures participants’ attitudes, perceptions, and behaviors. As described by Oliveira (2023), this type of scale combines statistical principles with foundations in psychology, capturing gradual variations in agreement or disagreement and enabling systematic interpretation of respondents’ perceptions.
According to Allen and Seaman (2007), five- or seven-point Likert scales provide consistent ordinal data and are suitable for studies involving subjective judgments. The authors emphasize that, when composed of multiple items related to the same dimension, the scale can be analyzed more robustly, supporting comparative analyses and helping explain phenomena associated with work processes and user experience.
In this study, the Likert scale was applied in the questionnaire developed in Google Forms, in which participants indicated their level of agreement with statements related to the metrics evaluated, including Design System adoption, delivery speed, rework, and ease of maintenance. A five-point format was used, ranging from “strongly disagree” to “strongly agree,” including a neutral option. This format balances positive and negative categories, makes it easier for respondents to understand, and contributes to statistical analysis of the responses obtained.
Although seven-point scales provide greater sensitivity in capturing perceptual nuances, the five-point format was chosen because it was better suited to the research context and respondents’ profiles. This configuration reduces the instrument’s cognitive complexity, makes alternatives easier to understand, and contributes to more consistent responses in self-administered questionnaires without compromising data reliability.
3.7 Research Metrics
This section presents the variables analyzed in the study, as well as the metrics used to measure each one. These variables were clearly defined based on the concepts discussed in the theoretical background, enabling a structured and coherent analysis of the collected data and providing a basis for identifying patterns, trends, and opportunities to improve digital public-sector development processes.
3.7.1 Design System Adoption
The Design System adoption metric aimed to identify the extent to which this strategy is used in the digital solution development process. This choice is grounded in studies by Konaté (2018) and Linder and Nilsson (2022), who emphasize the role of Design Systems in visual standardization, interface consistency, and integration between design and development teams. According to these authors, systematically adopting a Design System reflects organizational maturity and the consolidation of collaborative practices throughout the development cycle.
The following question was therefore formulated in the research instrument: “To what extent does your team use Design Systems in the process of developing digital solutions?” Response options were structured using a five-point Likert scale, ranging from 1 (I do not use them) to 5 (I use them fully as part of the process), as follows:
- Level 1 - I do not use them: Absence of practices related to the use of Design Systems.
- Level 2 - I rarely use them: Occasional or isolated adoption of Design System components or guidelines.
- Level 3 - I use them moderately: Partial application of the Design System at certain stages of development.
- Level 4 - I use them frequently: Recurring use of Design System principles and components in the creation process.
- Level 5 - I use them fully as part of the process: Systematic and complete integration of the Design System throughout the development cycle.
3.7.2 Delivery Speed
The delivery speed metric aimed to evaluate participants’ perceptions of the Design System’s contribution to agility in digital solution development. This choice is based on Frick (2022) and Abdulhakeem et al. (2024), who point out that using reusable components and Component-Driven Development optimizes workflow and reduces production time.
The aim was therefore to understand the extent to which Design Systems affect reductions in development time and compliance with delivery deadlines. For this purpose, the questionnaire presented the following question: “In your experience, does using a Design System help reduce development time and speed up delivery?” Responses were organized into five evaluation levels representing different degrees of perceived influence:
- Level 1 - No influence: Using a Design System does not affect development time.
- Level 2 - Little influence: The Design System has a minimal impact on delivery agility.
- Level 3 - Moderate influence: The Design System is perceived as contributing partially to reducing development time.
- Level 4 - Significant influence: Using a Design System promotes notable gains in delivery speed.
- Level 5 - Decisively accelerates the delivery process: The Design System is perceived as a determining factor in optimizing timelines and increasing productivity.
3.7.3 Amount of Rework
The amount of rework metric aimed to evaluate the impact of using Design Systems on reducing errors, adjustments, and repeated work throughout the digital interface development process. This analysis was based on studies by Gubau Amores, Voces Merayo, and Monclús Blanco (2024), who demonstrate that centralizing components and visual guidelines in UI libraries promotes consistency and reduces discrepancies between design and code. The aim was therefore to understand whether adopting a Design System helps increase efficiency and minimize the need for subsequent corrections.
For this purpose, the questionnaire presented the following question: “Does using Design Systems help reduce the need for rework during digital interface development?” Responses were structured into five evaluation levels representing different perceptions of the Design System’s impact on reducing rework:
- Level 1 - Does not reduce rework: Using a Design System does not influence the occurrence of repeated work.
- Level 2 - Minimally reduces rework: A small decrease in the amount of rework is perceived.
- Level 3 - Moderately reduces rework: The Design System makes a noticeable but partial contribution to reducing rework.
- Level 4 - Significantly reduces rework: Using a Design System substantially reduces necessary corrections and adjustments.
- Level 5 - Virtually eliminates the need for rework: The Design System is perceived as a determining element in eliminating inconsistencies and rework in development.
3.7.4 Ease of Maintenance
The ease of maintenance metric aimed to evaluate development and design professionals’ perceptions of the simplicity of updating, correcting, and maintaining digital interfaces when a Design System is used in the creation process. This analysis is based on Izotov (2020), who emphasizes the importance of governance, documentation, and test automation in component-based systems, elements that support scalability and the continuous evolution of interfaces. This metric therefore seeks to verify whether the standardization promoted by Design Systems helps optimize the maintenance cycle and reduce the technical complexity of digital solutions.
For this purpose, the questionnaire presented the following question: “How easy is it to update and maintain digital interfaces when a Design System is used in the process?” Responses were distributed across five evaluation levels representing different perceptions of the degree of maintenance ease provided by using a Design System:
- Level 1 - Very difficult to maintain: Using a Design System does not facilitate interface maintenance activities.
- Level 2 - Difficult to maintain: The Design System is perceived as making a limited contribution to maintaining digital solutions.
- Level 3 - Neutral: Using a Design System does not significantly affect ease of maintenance.
- Level 4 - Easy to maintain: The Design System is perceived as facilitating the process of updating and maintaining interfaces.
- Level 5 - Very easy to maintain: Using a Design System substantially simplifies maintenance activities, promoting efficiency and agility in updates.
3.8 Sample Characteristics
The sample consisted of professionals working in digital solution development and design at the participating agencies. Information about respondents’ roles and length of experience was collected to characterize the sample. The final sample included only professionals from PRODATER and SEAD, since ETIPI and Opala Lab did not submit responses within the data collection period.
Although this absence reduces the institutional breadth originally planned, the data obtained provide a consistent overview of Design System use at two levels of government, municipal and state. This scope makes it possible to identify relevant perceptions of design and development practices in the public sector, although the conclusions cannot be generalized to the entire Piauí context.
3.9 Data Analysis Procedures
Data analysis was conducted quantitatively using descriptive statistical procedures. After collection ended, responses recorded in Google Forms were exported in CSV format for checking and organization. The information was then structured in spreadsheets to facilitate calculations of frequencies, percentages, and measures of central tendency.
Variables measured using the Likert scale were treated as ordinal data. The mean, median, and standard deviation of responses were calculated for each metric evaluated. These procedures made it possible to present an objective overview of participants’ perceptions of the adoption and impact of Design Systems on digital interface development practices.
In addition to numerical analysis, respondents’ open-ended comments were grouped and examined descriptively. These textual records were consulted solely to identify recurring perceptions and complement the overall understanding of the data, without undertaking in-depth interpretations, in keeping with the descriptive nature of the research.
4. Results
This section objectively presents the data obtained through the questionnaire administered to research participants. Results are presented through tables, charts, and numerical descriptions to record the information collected clearly and systematically. No analytical interpretations are made at this stage; presentation is restricted to the empirical evidence obtained, which will form the basis for the discussion in the following section.
4.1 Sample Characteristics
A total of 13 valid responses were recorded. The distribution of participants by institution is presented below:
Table 1 - Distribution of respondents from participating and nonparticipating institutions
| Institution | Scope of activity | Number | Percentage |
|---|---|---|---|
| PRODATER | Municipal (Teresina) | 11 | 84.6% |
| SEAD | State | 2 | 15.4% |
| ETIPI | State | 0 | 0% |
| Opala Lab (TJPI) | State judiciary | 0 | 0% |
Source: Prepared by the author (2025).
4.2 Respondent Profiles
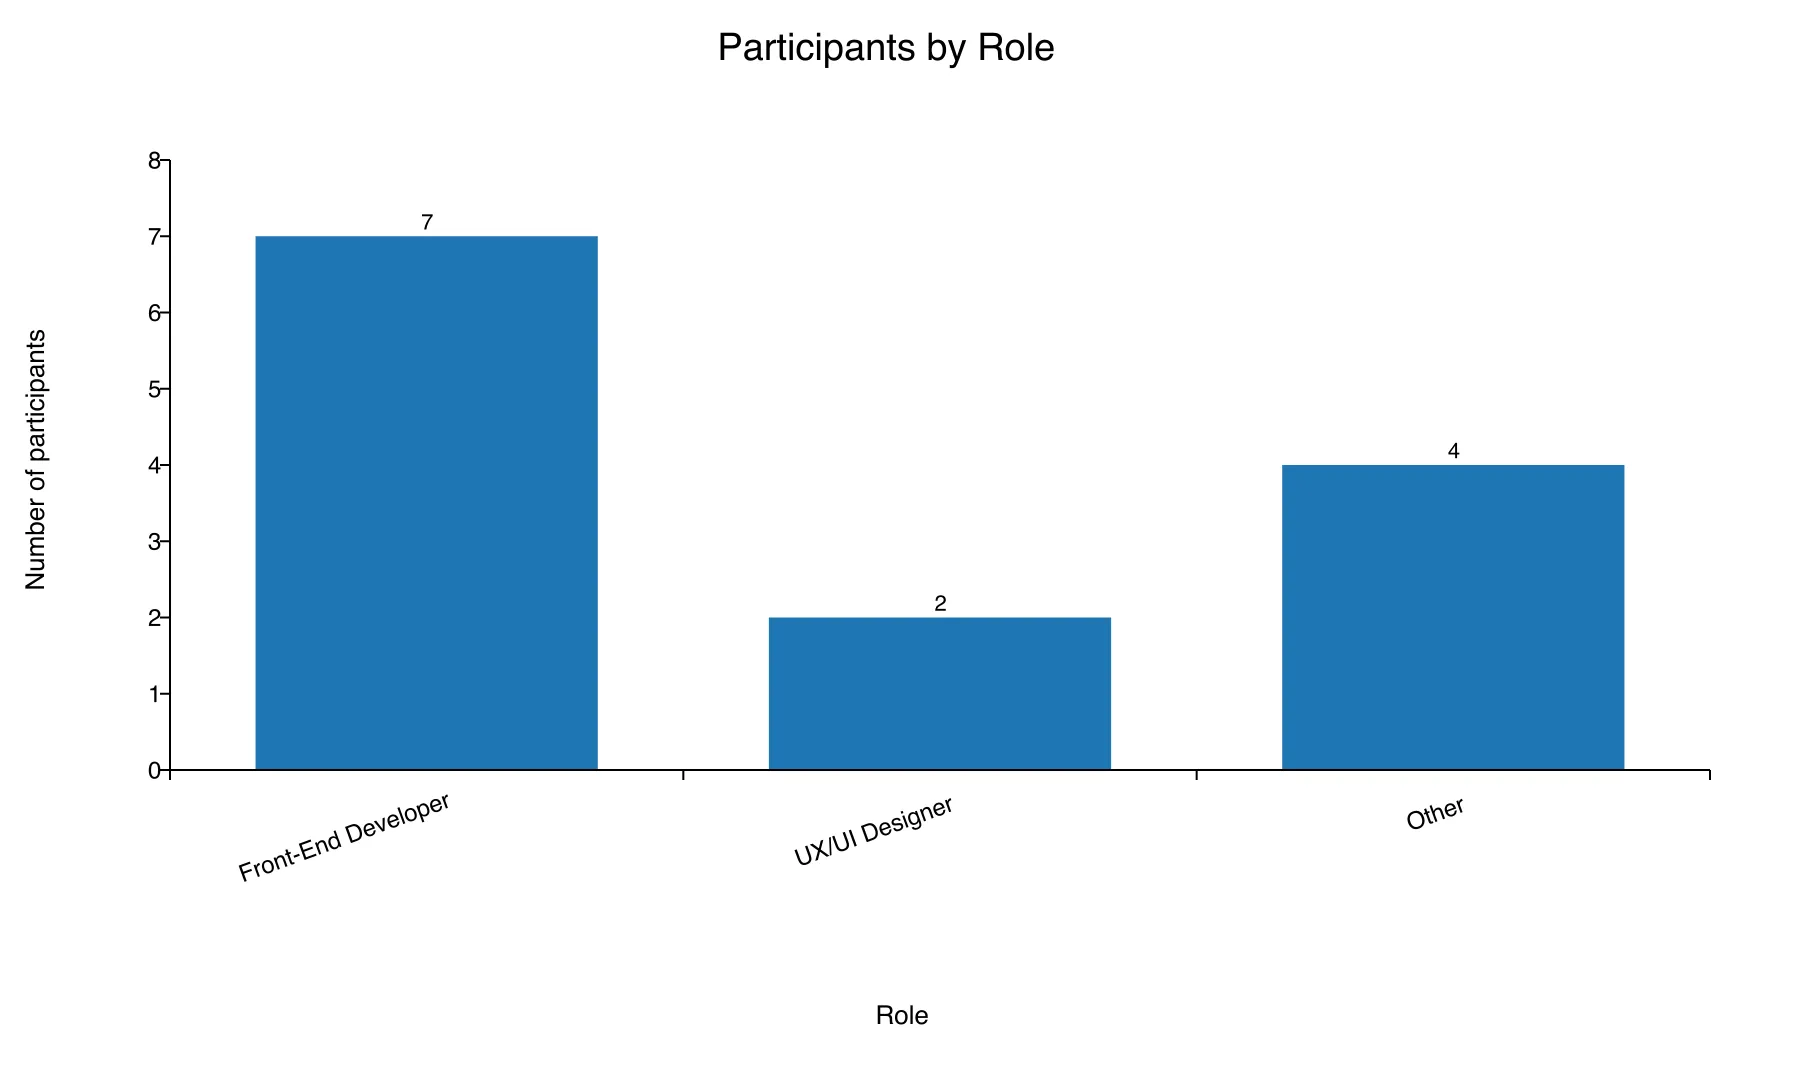
The sample in this study consists of 13 participants distributed across different roles related to digital interface development. Although the questionnaire was primarily aimed at front-end development and UI/UX design professionals, responses were also recorded from participants in other technical areas, demonstrating that the Design System influences diverse work routines within the institutions.
Table 2 - Distribution of respondents by role
| Role | Number |
|---|---|
| Front-End Developer | 7 |
| UX/UI Designer | 2 |
| Other | 4 |
Source: Prepared by the author (2025).
Figure 1 - Distribution of the number of participants by role
Source: Prepared by the author (2025). English labels translated for this edition.
Original figure from the Portuguese thesis
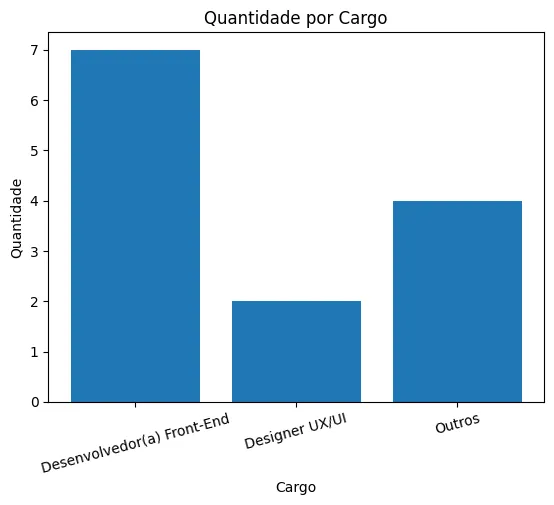
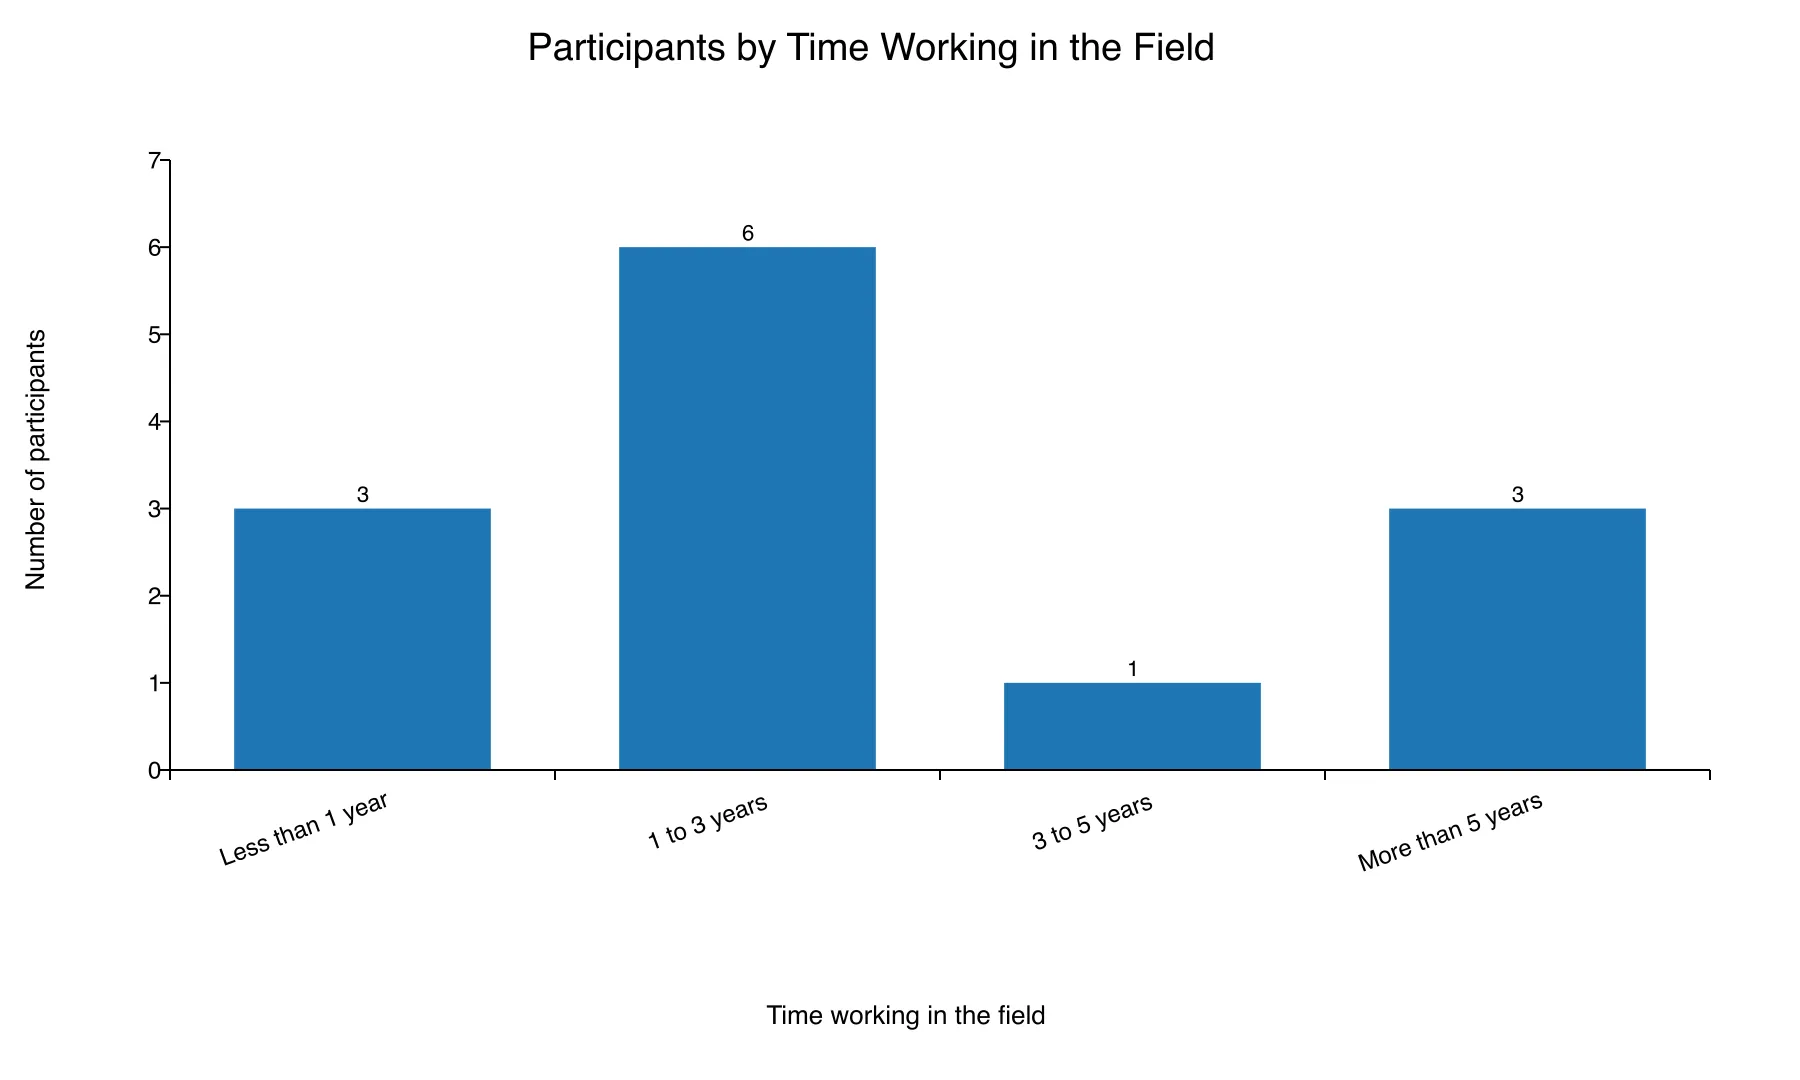
Table 3 presents the distribution of time working in the field reported by participants. For the calculation of descriptive measures, each range was converted into a representative numerical value: less than 1 year = 0.5; 1 to 3 years = 2; 3 to 5 years = 4; more than 5 years = 6.
Table 3 - Time working in the field (n = 13)
| Time working in the field | Number |
|---|---|
| Less than 1 year | 3 |
| 1 to 3 years | 6 |
| 3 to 5 years | 1 |
| More than 5 years | 3 |
Source: Prepared by the author (2025).
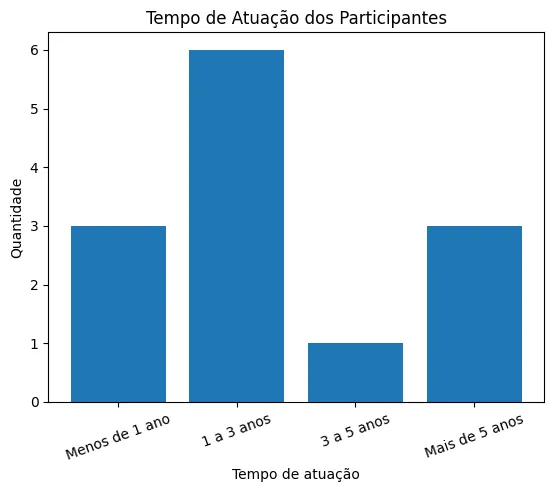
Figure 2 - Distribution of the number of participants by time working in the field
Source: Prepared by the author (2025). English labels translated for this edition.
Original figure from the Portuguese thesis
Measures of central tendency (estimated time in years):
- Mean: 2.69 years.
- Median: 2 years.
- Standard deviation: 2.06 years.
4.3 Overall Results for the Metrics Evaluated
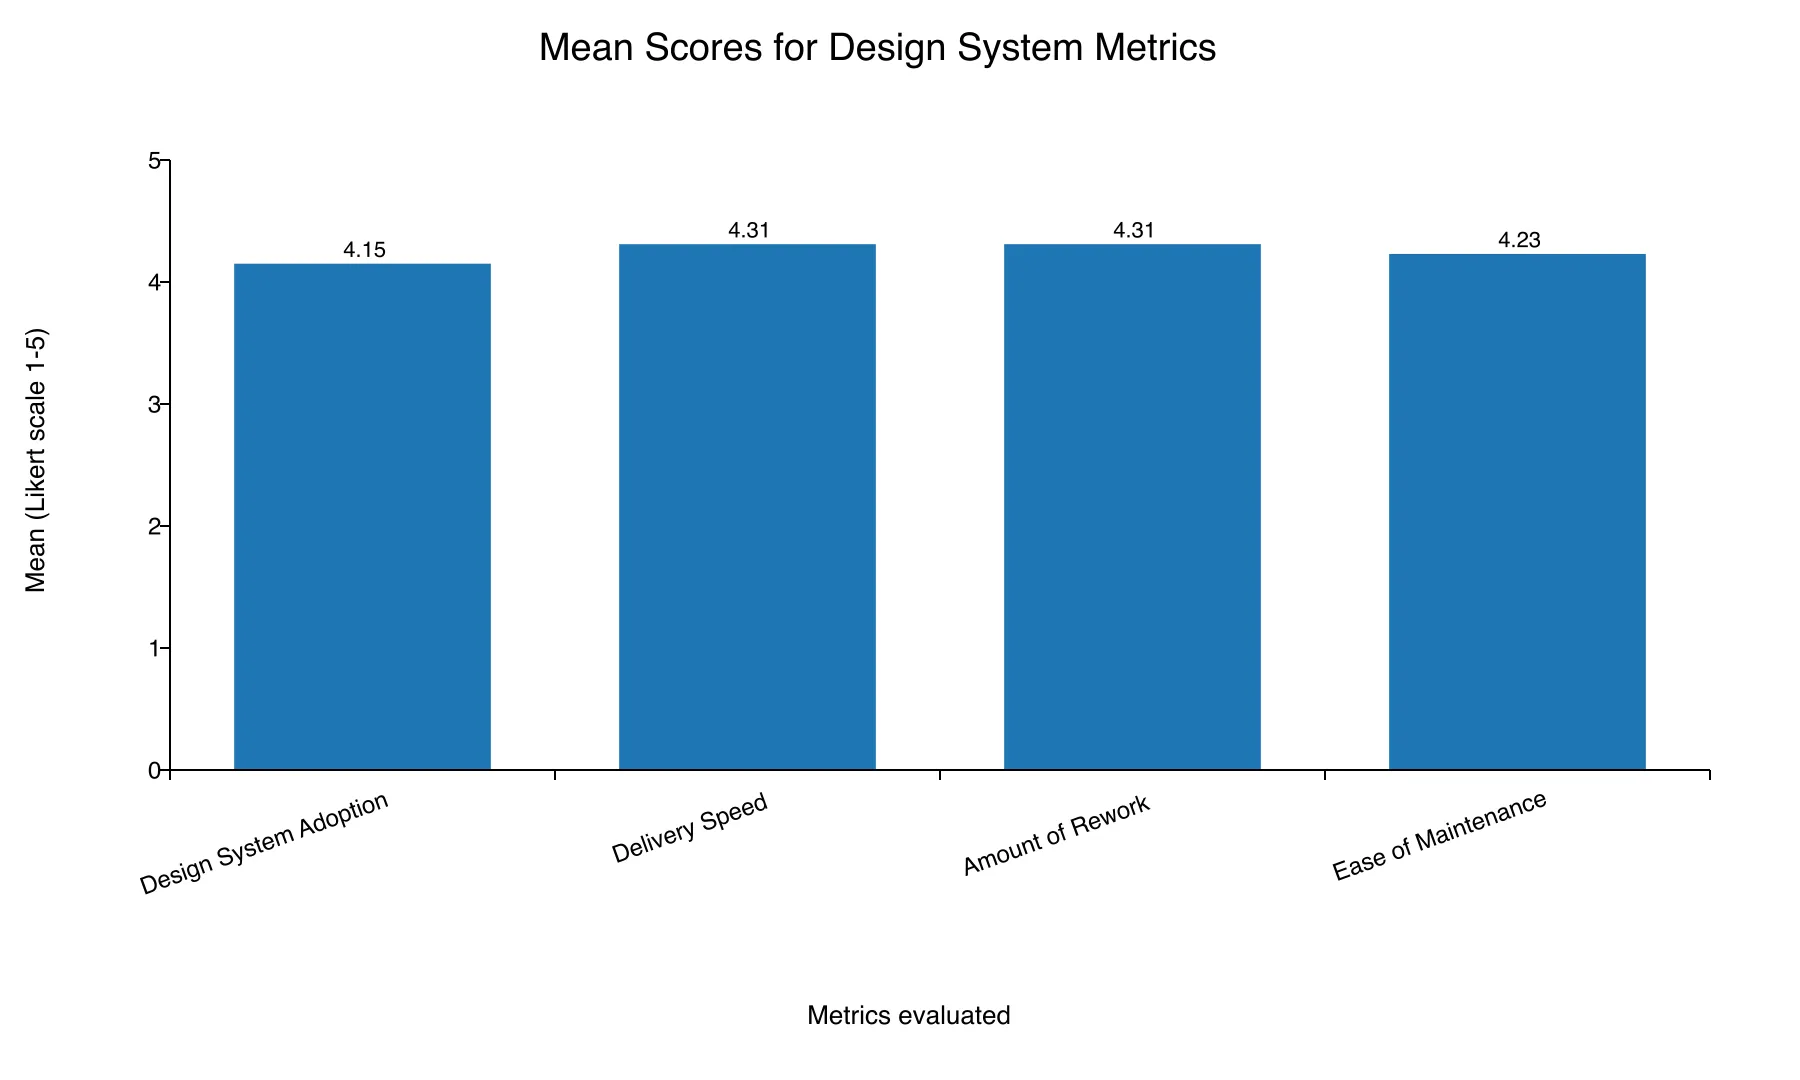
The four metrics analyzed were Design System Adoption, Delivery Speed, Amount of Rework, and Ease of Maintenance. Responses were obtained using a five-point Likert scale.
Table 4 - Descriptive statistics for the metrics evaluated (n = 13)
| Metric | Mean | Median | Standard deviation |
|---|---|---|---|
| Design System Adoption | 4.15 | 4 | 0.80 |
| Delivery Speed | 4.31 | 4 | 0.75 |
| Amount of Rework | 4.31 | 4 | 0.63 |
| Ease of Maintenance | 4.23 | 4 | 0.93 |
Source: Prepared by the author (2025).
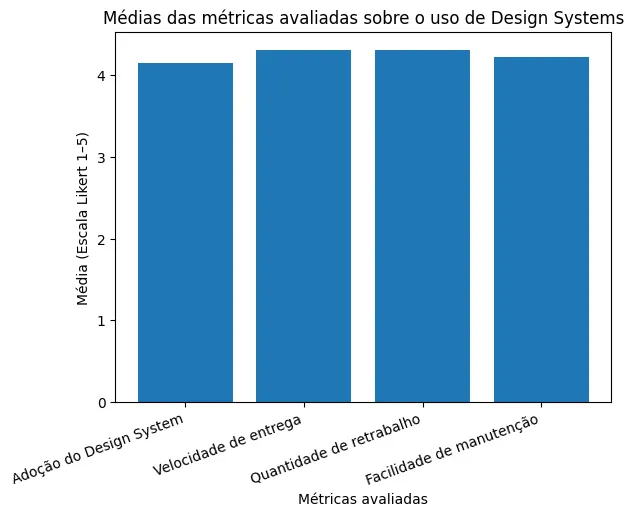
Figure 1 - Mean scores for the metrics evaluated regarding the use of Design Systems
Source: Prepared by the author (2025). English labels translated for this edition.
Original figure from the Portuguese thesis
4.4 Results by Institution
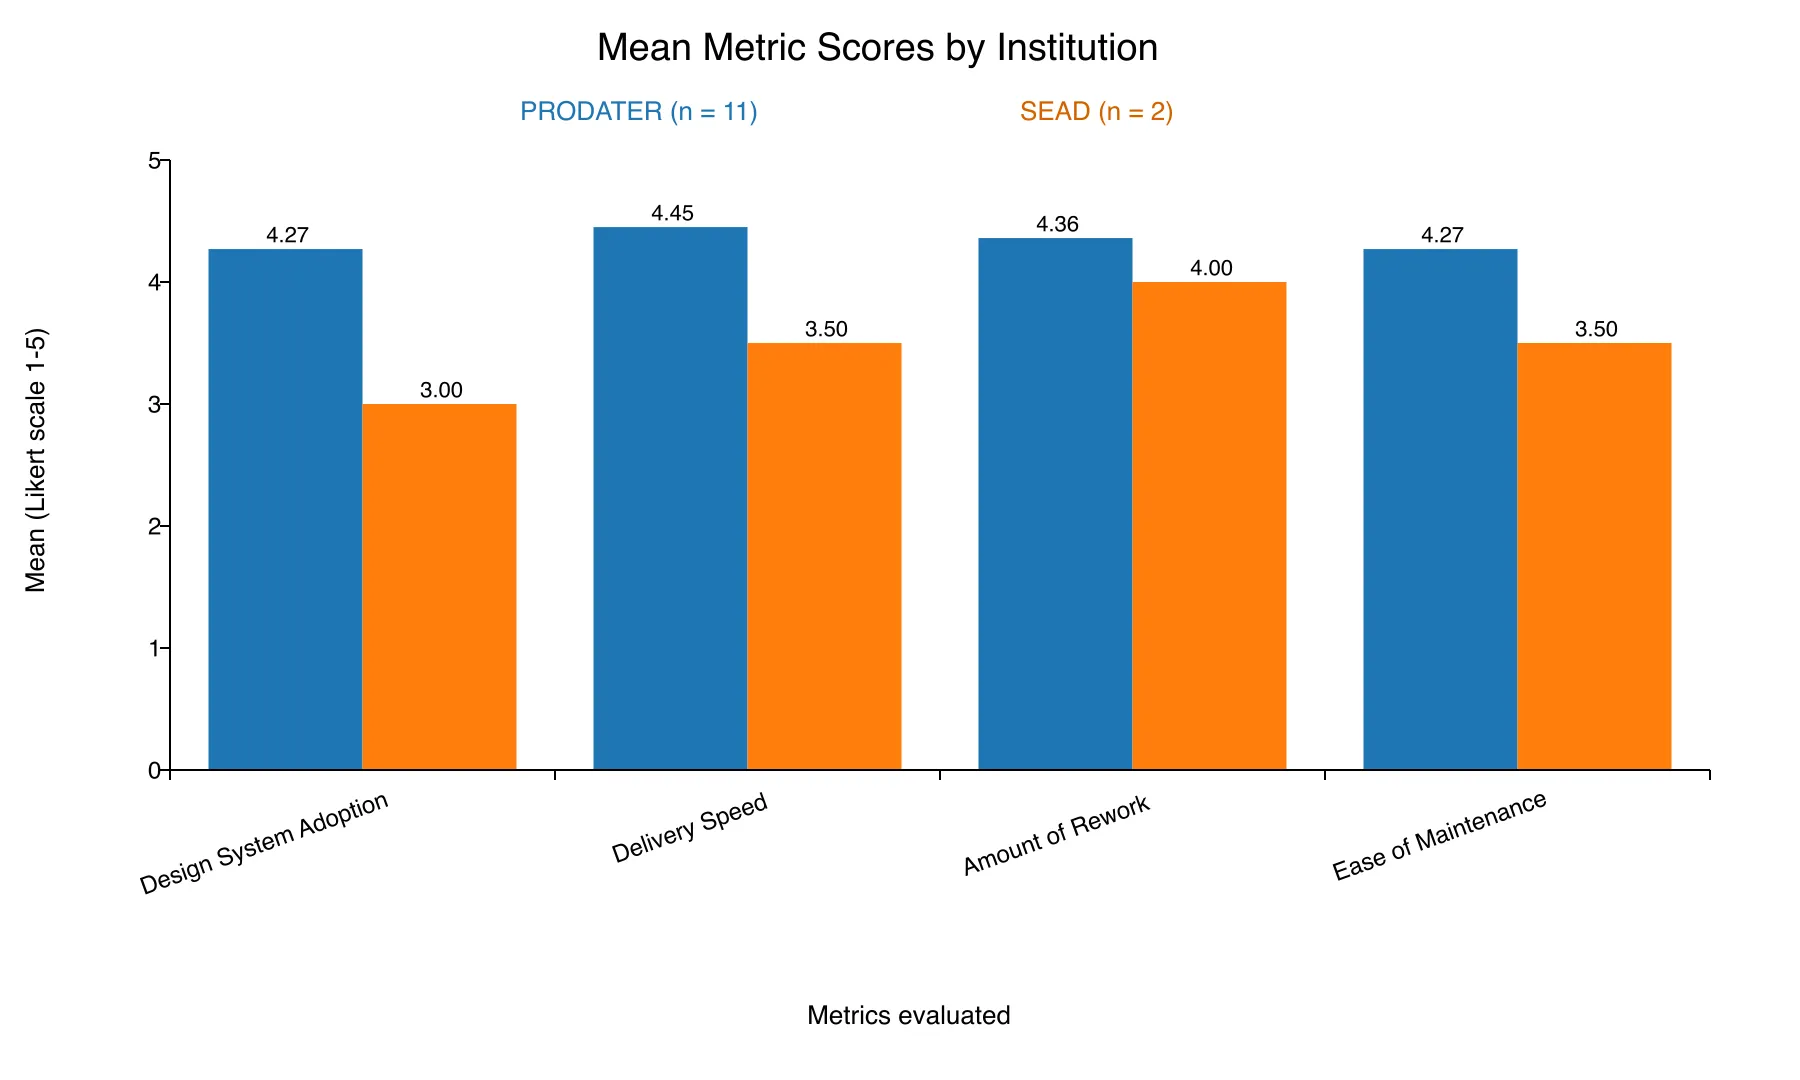
Results were analyzed separately for the two institutions that submitted responses.
PRODATER (n = 11)
- Design System Adoption: mean 4.27.
- Delivery Speed: mean 4.45.
- Amount of Rework: mean 4.36.
- Ease of Maintenance: mean 4.27.
SEAD (n = 2)
- Design System Adoption: mean 3.00.
- Delivery Speed: mean 3.50.
- Amount of Rework: mean 4.00.
- Ease of Maintenance: mean 3.50.
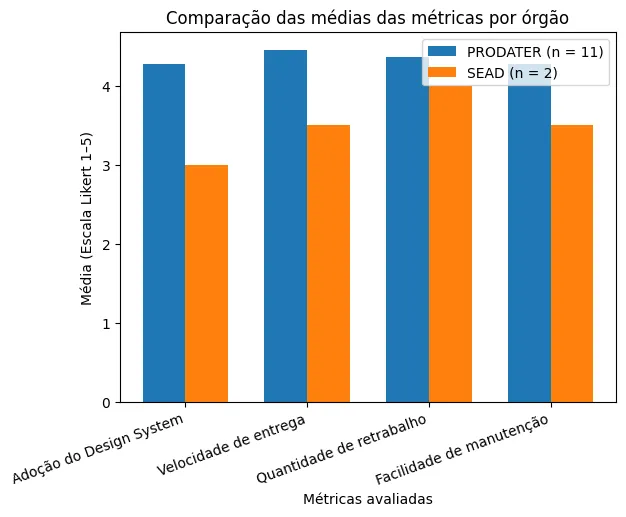
Figure 2 - Comparison of mean scores for the metrics evaluated by institution
Source: Prepared by the author (2025). English labels translated for this edition.
Original figure from the Portuguese thesis
4.5 Qualitative Comments
The comments recorded by participants indicated broadly positive perceptions of using Design Systems in interface development. Among the benefits mentioned, process agility, visual consistency across different screens, clear direction for new projects, and reduced rework stood out.
Respondents reported that standardized components and consolidated guidelines facilitate the development workflow, improve understanding of what needs to be implemented, and contribute to more stable and organized processes. This structure was also associated with increased efficiency, since it establishes previously evaluated measurements, layouts, and criteria, reducing the need for modifications during implementation.
On the other hand, some participants identified challenges related to using the tool. These included the complexity of maintenance when few specialized professionals are available and the perception that, in some cases, a Design System may restrict necessary flexibility, creating a sense of obligation to follow the established rules rigidly.
5. Discussion
The objective of this research was to analyze the influence of Design Systems on the development of digital public service interfaces in Piauí, considering aspects such as adoption, delivery speed, rework, and ease of maintenance. The results obtained make it possible to understand how these tools have been incorporated by technical teams and how they affect workflow, deliverable quality, and the organization of internal processes.
The quantitative results revealed means above four points for all metrics evaluated, indicating a broadly positive perception of the use of Design Systems. These findings align with studies identifying these systems as instruments capable of promoting visual consistency, standardization, and component reuse, factors that support communication among multidisciplinary teams and the quality of the interfaces developed. The high score assigned to rework reduction reinforces this perspective, since component centralization reduces inconsistencies between design and implementation.
Another relevant aspect concerns the diversity of professional profiles represented in the research. Although the questionnaire was primarily aimed at front-end developers and UX/UI designers, responses were also recorded from professionals in systems analysis, quality assurance, and data science. This diversity demonstrates that the impact of Design Systems extends beyond visual design to the different stages of software development, reinforcing their sociotechnical nature.
The results also demonstrated a positive relationship between Design System use and delivery speed. Participants mentioned that component reuse reduces the time required to conceive and develop screens, supporting greater delivery predictability. The combination of greater speed and less rework suggests significant operational gains, consistent with research associating Design Systems with development workflow maturity and production process efficiency.
The qualitative comments reinforced these findings by highlighting advantages such as clear guidelines, organized layouts, easier visual decision-making, and implementation stability. Conversely, challenges were reported concerning the need for continuous Design System maintenance, particularly in smaller teams, and a perception of rigidity when there is little flexibility for specific adaptations. These challenges align with the literature, which identifies governance, ongoing updates, and a balance between standardization and adaptability as central elements in a Design System’s success.
Respondents’ average length of experience, estimated at 2.69 years, made it possible to observe the perceptions of both early-career and more experienced professionals. The predominance of positive evaluations across different levels of maturity suggests that the benefits identified are not limited to a single group.
The sample composition represents an important limitation of the research. Although four institutions were invited to participate, only two submitted responses during the collection period, reducing institutional diversity and limiting the breadth of the results. Furthermore, the total number of respondents, although sufficient for descriptive analyses, remains limited and may not represent the state’s entire digital ecosystem. Acknowledging these limitations is essential to avoiding unwarranted generalizations and properly situating the scope of the findings.
Even with these restrictions, the results make it possible to identify relevant trends in the use of Design Systems in Piauí’s public sector. The data indicate that adopting this approach positively influences development, maintenance, and work organization practices, contributing to greater consistency, efficiency, and quality in the digital solutions produced. They also reveal opportunities for improvement, such as strengthening governance practices and continuously updating components.
6. Conclusion
This study aimed to analyze the influence of Design Systems on the development of digital public service interfaces in Piauí, considering adoption, delivery speed, rework reduction, and ease of maintenance. Based on the data obtained, the general objective was achieved, making it possible to understand how these tools have been incorporated and perceived by the participating agencies’ technical teams.
Specifically, the extent of Design System adoption was analyzed through a dedicated metric, revealing high utilization by teams (mean 4.15). Their contribution to reducing rework (mean 4.31) and their influence on delivery speed (mean 4.31) were positively evaluated. Ease of maintenance and continuous evolution of digital interfaces were also examined, with a perception of substantial facilitation (mean 4.23).
The quantitative results indicated predominantly positive evaluations across all metrics analyzed. Means above four points on the Likert scale show that Design Systems have contributed to greater agility, predictability, and visual consistency in interface development. Qualitative responses reinforced this perception by highlighting improvements in workflow organization, clarity of guidelines, and reduced subsequent changes.
However, challenges related to ongoing system maintenance and the need for team training were mentioned, aspects that are fundamental to ensuring organizational maturity in the use of this type of tool. The research also showed that the impact of Design Systems extends beyond visual design activities to other technical profiles, such as quality assurance and systems analysis professionals, reinforcing their sociotechnical role.
Regarding the hypotheses raised, the results provide strong indications supporting both, even considering the limited sample. Hypothesis 1, which proposed that using Design Systems positively influences development process efficiency by increasing delivery speed and reducing rework, is corroborated by the high means obtained for Delivery Speed (4.31) and Amount of Rework (4.31). Similarly, Hypothesis 2, which suggested that using Design Systems contributes to the quality and sustainability of digital solutions by promoting standardization, consistency, and ease of maintenance, finds support in the high mean for Ease of Maintenance (4.23) and the general perception of visual consistency and organization.
Despite the relevance of the findings, the study has limitations. The sample included only two participating institutions and a small number of respondents, preventing generalization of the results to the state’s entire digital ecosystem. Nevertheless, the trends identified are important for understanding the current use of Design Systems in Piauí and provide a solid basis for improvement initiatives.
Based on these limitations, future studies could expand the number of institutions and participants involved, as well as explore the specific perceptions of different technical roles and experience levels. More in-depth research could investigate governance practices, strategies for continuously updating components, and the effectiveness of training programs focused on Design Systems in the public sector. Other possibilities include comparative studies of agencies with different levels of maturity and longitudinal analyses tracking the evolution of these tools over time, as well as continuing the research in agencies not covered, such as ETIPI and TJPI.
It is therefore concluded that this research contributes to understanding the adoption of Design Systems in Piauí’s public sector and provides relevant input for improving digital design practices. By recording empirical evidence and indicating paths for evolution, the study strengthens the discussion of the importance of Design Systems in improving deliverables, process efficiency, and the advancement of digital transformation in public administration.
References
Reference titles originally published in English are retained. Portuguese titles are followed by English translations in brackets to preserve source identification.
ABDULHAKEEM, Alaa; SAEED, Sabri; MUSTAFA, Nada; IBRAHIM, Mohammed A. M.; AL-TAYAR, Basheer; et al. Enhancing Frontend Efficiency: Reusability and Testability in Component-Driven Development. In: 4th International Conference on Emerging Smart Technologies and Applications (eSmarTA), 2024. IEEE, 2024. DOI: 10.1109/esmarta62850.2024.10638895. Available at: IEEE Xplore. Accessed: October 13, 2025.
ALLEN, I. Elaine; SEAMAN, Jeff. Likert scales and data analyses. Bay View Analytics, 2007. Available at: Bay View Analytics. Accessed: November 27, 2025.
BRASIL. Padrão Digital de Governo - Design System: Sobre o Design System [Government Digital Standard - Design System: About the Design System]. Portal Gov.br, 2024. Available at: Gov.br Design System. Accessed: November 25, 2025.
BRASIL. Brasil é reconhecido como segundo líder em governo digital no mundo [Brazil is recognized as the world’s second leader in digital government]. Gov.br, 2022. Available at: Gov.br. Accessed: August 15, 2025.
ETIPI. Quem somos [About us]. Empresa de Tecnologia da Informação do Estado do Piauí [State of Piauí Information Technology Company]. Available at: ETIPI. Accessed: August 25, 2025.
FIGMA. Design systems 101: what is a design system? 2024. Available at: Figma. Accessed: August 15, 2025.
FOLHA PIAUÍ. Piauí é premiado pela ABEP como o estado mais digital do Brasil [Piauí receives an ABEP award as Brazil’s most digital state]. [n.d.]. Available at: Folha Piauí. Accessed: August 15, 2025.
FRICK, Albin. From Design to Code: A Study on Generating Production Code From User Interface Design Software. Umeå University, Faculty of Science and Technology, Department of Applied Physics and Electronics, 2022. Degree project / thesis (advanced level), Umeå University, 2022. Available at: DiVA Portal. Accessed: October 13, 2025.
GOOGLE. Google Forms. Google Workspace, [n.d.]. Available at: Google Workspace. Accessed: August 26, 2025.
GUBAU AMORES, Pol; VOCES MERAYO, Ramón; MONCLÚS BLANCO, Belén. Planning, Designing, and Building a Customized UI Library: A Step-by-Step Guide for Improving Frontend Development. 2024. Undergraduate thesis (Bachelor’s Degree in Interactive Communication), Universitat Autònoma de Barcelona, 2024. Available at: UAB Digital Repository. Accessed: October 10, 2025.
GUJAR, Praveen. The Road Ahead for Software Usability. In: GUJAR, Praveen (Ed.). Data Usability in the Enterprise. Berkeley, CA: Apress, 2025. pp. 425-455. DOI: 10.1007/979-8-8688-1183-8_15. Available at: Springer. Accessed: October 15, 2025.
IZOTOV, Dmytro. Design System Development. 2020. Undergraduate thesis (Bachelor’s Degree in Software Engineering), Metropolia University of Applied Sciences, Helsinki, 2020. Available at: Theseus. Accessed: October 13, 2025.
KHALILOVA, Tohfa. Evaluating and Enhancing User Experience in an Existing UI Component Library. 2025. Master’s Thesis (Master’s Degree in Information Technology), Czech University of Life Sciences Prague, Prague, 2025. Available at: Theses.cz. Accessed: October 20, 2025.
KONATÉ, Aïcha. Design systems at work: Optimizing design processes and aligning design work to company identity. 2018. 82 leaves. Master’s thesis (Collaborative and Industrial Design), Aalto University School of Arts, Design and Architecture, Espoo, 2018. Available at: Aalto University. Accessed: October 10, 2025.
LINDER, Anton; NILSSON, Mattias. Designing a Design System for Coherent Tactical GUIs. 2022. Master’s Thesis, Chalmers University of Technology, Gothenburg, 2022. Available at: Chalmers. Accessed: October 10, 2025.
LINDGREN, Ida; VAN VEENSTRA, Anne Fleur. Digital government transformation: A case illustrating public e-service development as part of public sector transformation. In: Proceedings of the 19th Annual International Conference on Digital Government Research, 2018. ACM, 2018. pp. 1-6. DOI: 10.1145/3209281.3209302. Available at: ACM Digital Library. Accessed: October 16, 2025.
MALODIA, Suresh; DHIR, Amandeep; MISHRA, Mahima; BHATTI, Zeeshan Ahmed. Future of e-Government: An integrated conceptual framework. Technological Forecasting & Social Change, vol. 173, article 121102, 2021. DOI: 10.1016/j.techfore.2021.121102. Available at: ScienceDirect. Accessed: October 15, 2025.
NAPOLEÃO, Bianca Minetto. Estabelecendo uma string de busca para a identificação de estudos secundários na Engenharia de Software [Establishing a search string for identifying secondary studies in Software Engineering]. 2019. Master’s dissertation (Computer Science), Universidade Tecnológica Federal do Paraná, Curitiba, 2019. Available at: UTFPR Institutional Repository. Accessed: November 27, 2025.
NIELSEN, Morten Meyerhoff; BARBOSA, Luís Nuno. Ensuring Online Usability and Value: A Comparative Analysis of the Design Standards, Criteria, and Governance Models in Denmark, Portugal, and the UK. In: 15th International Conference on Theory and Practice of Electronic Governance (ICEGOV), 2022, Pretoria. Proceedings. ACM, 2022. pp. 1-10. DOI: 10.1145/3680127.3680217. Available at: ACM Digital Library. Accessed: October 15, 2025.
OLIVEIRA, Aline. Entenda o que é Escala Likert [Understanding the Likert scale]. MindMiners, August 28, 2023. Available at: MindMiners. Accessed: August 25, 2025.
OPALA LAB - LABORATÓRIO DE INOVAÇÃO DO TRIBUNAL DE JUSTIÇA DO ESTADO DO PIAUÍ [Innovation Laboratory of the Court of Justice of the State of Piauí]. Available at: Opala Lab. Accessed: August 25, 2025.
PRODATER. Missão [Mission]. Empresa Teresinense de Processamento de Dados [Teresina Data Processing Company]. Teresina Municipal Government. Available at: PRODATER. Accessed: August 25, 2025.
SEAD - SECRETARIA DE ADMINISTRAÇÃO DO ESTADO DO PIAUÍ [State of Piauí Department of Administration]. Apresentação [Presentation]. Available at: SEAD. Accessed: August 25, 2025.
WOWMAKERS. UI/UX Designer vs Front-End Developer: understanding the key differences. [n.d.]. Available at: Wowmakers. Accessed: August 17, 2025.
XISTO, Adriana et al. Interoperability of Digital Government Services: A Brazilian Reference Architecture Model to Promote Communication, Management, and Reuse of Solutions. In: ALMEIDA, João Paulo A. et al. (eds.). Enterprise Design, Operations, and Computing. EDOC 2022. Lecture Notes in Computer Science, vol. 13585. Cham: Springer, 2022. pp. 91-107. DOI: 10.1007/978-3-031-17604-3_6. Available at: DOI. Accessed: October 20, 2025.
Annex A - Full Questionnaire Administered to Research Participants
Questionnaire Title
Survey: Design Systems in the Development of Digital Public Service Interfaces in Piauí.
Questionnaire Description
This questionnaire is part of an undergraduate thesis investigating how the use of Design Systems influences the development of digital public service interfaces in Piauí. Responses are anonymous, take approximately five minutes to complete, and will be used exclusively for academic purposes. We appreciate participants’ collaboration.
About You
Description:
These questions aim to identify the profiles of research participants. No personal information will be disclosed.
What is your primary role? (required)
- UX/UI Designer
- Front-End Developer
- Other
How long have you worked in this field? (required)
- Less than 1 year
- 1 to 3 years
- 3 to 5 years
- More than 5 years
Which institution/agency do you currently work for? (required)
- SECTI / PRODATER
- ETIPI
- TJ-PI
- Investe Piauí
- SEAD
- Other
Have you ever participated in developing digital public services? (required)
- Yes
- No
Evaluation of Design System Use
Description:
In this section, we ask you to evaluate your experience using Design Systems during development. The following questions aim to measure, using a Likert scale from 1 to 5, the degree of influence of this practice on different aspects of the development process, such as adoption, agility, rework, and maintenance. For each question, select the alternative that best represents your perception according to the scale presented.
Design System Adoption: To what extent does your team use Design Systems in the process of developing digital solutions? (required)
- 1. I do not use them: Absence of practices related to the use of Design Systems.
- 2. I rarely use them: Occasional or isolated adoption of Design System components or guidelines.
- 3. I use them moderately: Partial application of the Design System at certain stages of development.
- 4. I use them frequently: Recurring use of Design System principles and components in the creation process.
- 5. I use them fully as part of the process: Systematic and complete integration of the Design System throughout the development cycle.
Delivery Speed: In your experience, does using a Design System help reduce development time and speed up delivery? (required)
- 1. No influence: Using a Design System does not affect development time.
- 2. Little influence: The Design System has a minimal impact on delivery agility.
- 3. Moderate influence: The Design System is perceived as contributing partially to reducing development time.
- 4. Significant influence: Using a Design System promotes notable gains in delivery speed.
- 5. Decisively accelerates the delivery process: The Design System is perceived as a determining factor in optimizing timelines and increasing productivity.
Amount of Rework: Does using Design Systems help reduce the need for rework during digital interface development? (required)
- 1. Does not reduce rework: Using a Design System does not influence the occurrence of repeated work.
- 2. Minimally reduces rework: A small decrease in the amount of rework is perceived.
- 3. Moderately reduces rework: The Design System makes a noticeable but partial contribution to reducing rework.
- 4. Significantly reduces rework: Using a Design System substantially reduces necessary corrections and adjustments.
- 5. Virtually eliminates the need for rework: The Design System is perceived as a determining element in eliminating inconsistencies and rework in development.
Ease of Maintenance: How easy is it to update and maintain digital interfaces when a Design System is used in the process? (required)
- 1. Very difficult to maintain: Using a Design System does not facilitate interface maintenance activities.
- 2. Difficult to maintain: The Design System is perceived as making a limited contribution to maintaining digital solutions.
- 3. Neutral: Using a Design System does not significantly affect ease of maintenance.
- 4. Easy to maintain: The Design System is perceived as facilitating the process of updating and maintaining interfaces.
- 5. Very easy to maintain: Using a Design System substantially simplifies maintenance activities, promoting efficiency and agility in updates.
Final Comment (optional)
Description:
If you wish, use the space below to share opinions, experiences, or suggestions about the use of Design Systems in developing digital public services. Your observations are very welcome and may contribute to a broader understanding of the challenges and benefits of this practice.